Introduction
LSST has an off-the-shelf Canon camera with a fisheye lens operating at the site. This camera takes 30 second exposures throughout the night and twilight time. The data is archived at NCSA and can be accessed at lsst-dev.ncsa.illinois.edu:/lsst/all-sky. Each night generates about 30 Gb of data (gzipped). The Canon simultaneously takes images in R, G, B Bayer filters.
Code to generate figures and values for this technote are in the repo sims_allSkyAnalysis.
Photometry with Canon
There is a standard astronomy pipeline for reducing the all-sky data (i.e., a random hodge-podge of scripts). This pipeline converts each Canon cr2 file to three .fits files, runs SExtractor, and fits the coordinate system. Stellar magnitudes of ~2000 known bright stars are recorded along with the sky brightness measured in an annulus around each star.
We attempted to use the stellar photometry catalog to run ubercal on the system. Unfortunately, in cloudy conditions the coordinate solution fails and the stars become mis-identified. Ubercal is not robust against this type of error.
Limits of Canon Photometry
Doing quick aperture photometry on some clear Canon frames reveals that the RMS variation on repeated measurements of the same star are a factor of 2-3 higher than expected from Poisson statistics. Even if all the flux from all the Bayer filters are combined, the noise level stays high. Therefore, to construct a transparency map out of the all-sky images, one would need more stars to compensate for the low-precision photometry.
If we want to generate a transparency map to pass to the LSST scheduler, we need to decide on the following parameters:
- Angular resolution on the celestial sphere
- Temporal resolution (setting the possible exposure time)
- Maximum extinction the maps should reliably extend to
- Precision of the extinction maps (e.g., plus-or-minus 0.1 mags of extinction at 1 mag of extinction)
These parameters combined with the stellar luminosity function at the galactic poles set the requirements on the all-sky camera photometry.
When we ran ubercal with an nside of 8 (~7 degree resolution), in clear images we were seeing a scatter of ~0.2 mags in the fitted zeropoints.
We can maximize the signal of the stars by combining the R, G, and B frames together. Even doing this, each exposure contains ~2,000 stars detected at the 3-sigma level. While that sounds like a lot, most of the stars are concentrated on the Galactic plane, so the galactic poles have very few (and often faint) stars detected by the Canon.
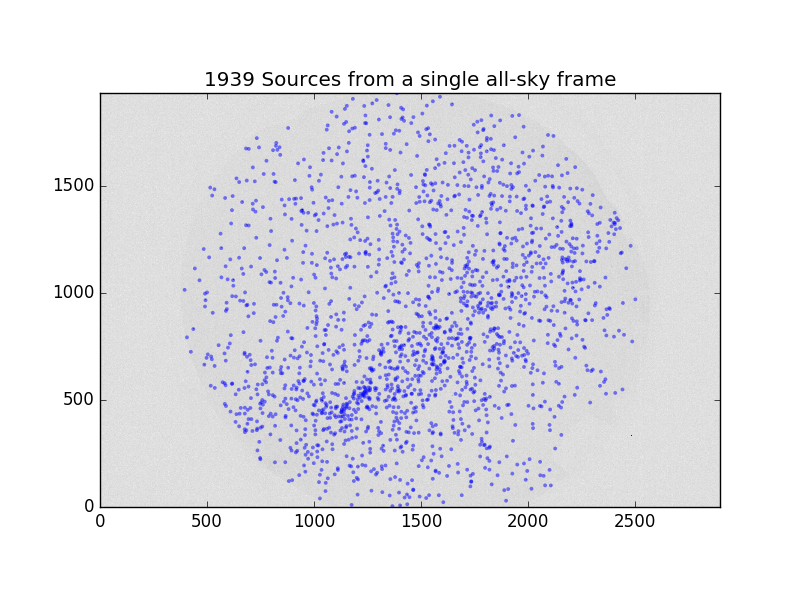
Figure 1 Results from searching for 3-sigma point source detections in a clear dark-time all-sky camera image.
Cloud Observations With Median Filtered All-Sky Images
Having established that photometry of bright stars is not adequate, we turn to the possibility of using the all-sky data to at least make masks of cloudy regions of the sky.
For this, we re-reduced the all-sky frames of all of 2015 and the first 4 months of 2016. We use a single coordinate fit assigning each pixel to a fixed altitude and azimuth. We then convert to RA,Dec for the given exposure and take a median value for all the image pixels in each HEALpixel with an nside=32 (110 arcminute resolution). This median filtering eliminates stars from the images, and compresses the data so that it only takes 116 Gb for the all the healpix maps from 368 nights.
We take a median of each healpixel when it is observed during darktime and an airmass less than 3. .. figures made by medmap.py in https://github.com/lsst-sims/sims_allSkyAnalysis/tree/master/python
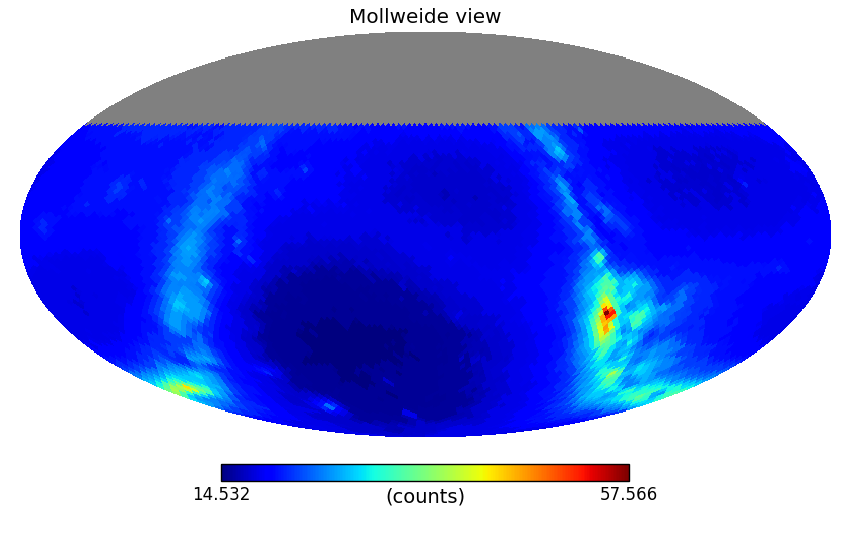
Figure 2 R-band
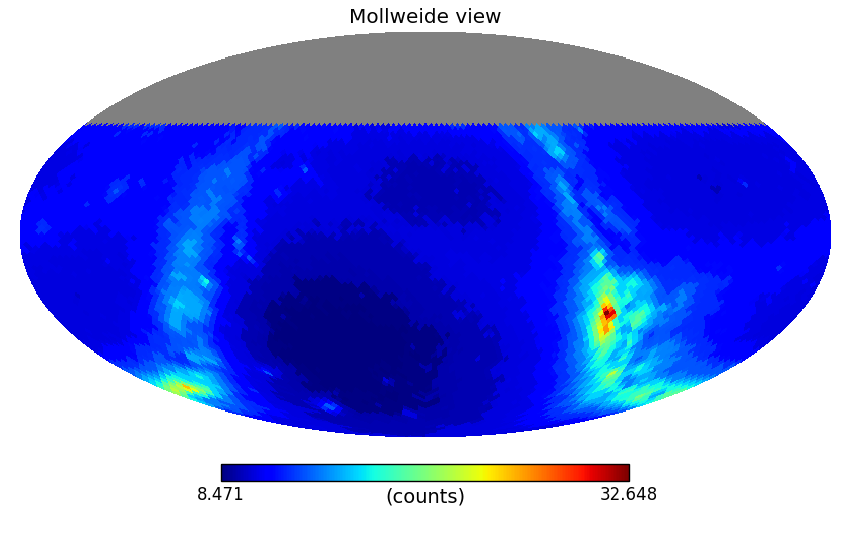
Figure 3 G-band
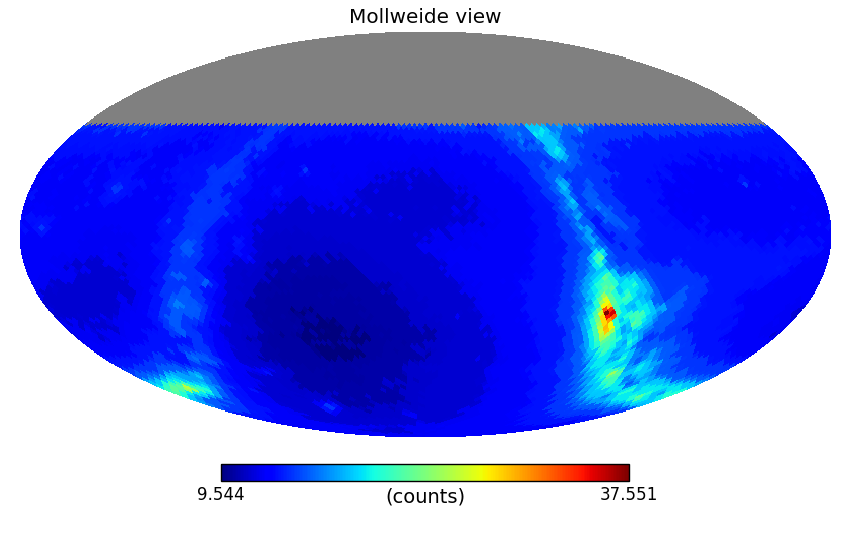
Figure 4 B-band
To generate a cloud mask, we take a difference image of a frame with the previous frame, smooth the difference image with a 5 degree FWHM Gaussian kernel, and flag pixels that are 3-sigma above or below the original difference image RMS.
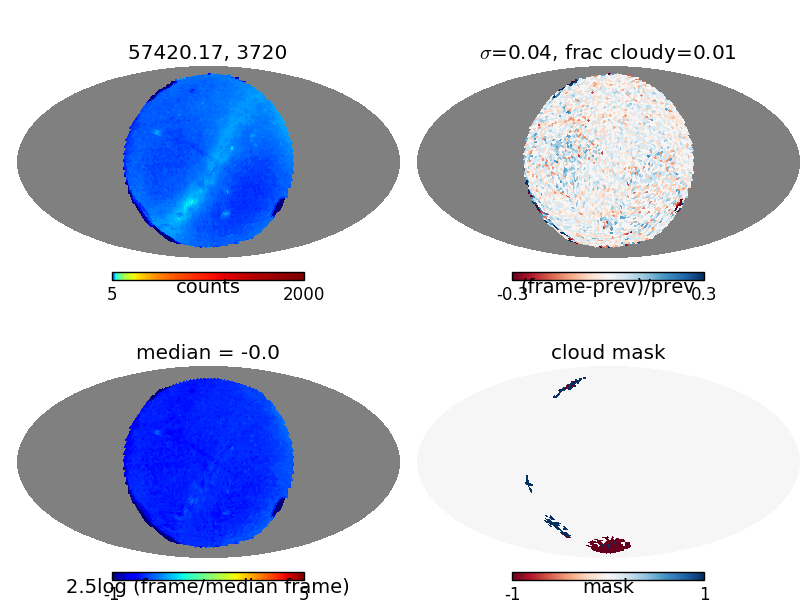
Figure 5 Example of how the all-sky camera can be used to detect clouds. Upper left shows the median-filtered healpixelized all-sky image (rotated so zenith is in the center). Upper right shows the difference with the previous frame. Lower left show the difference of the frame with the median dark-time image. Lower right shows pixels flagged as possibly cloudy.
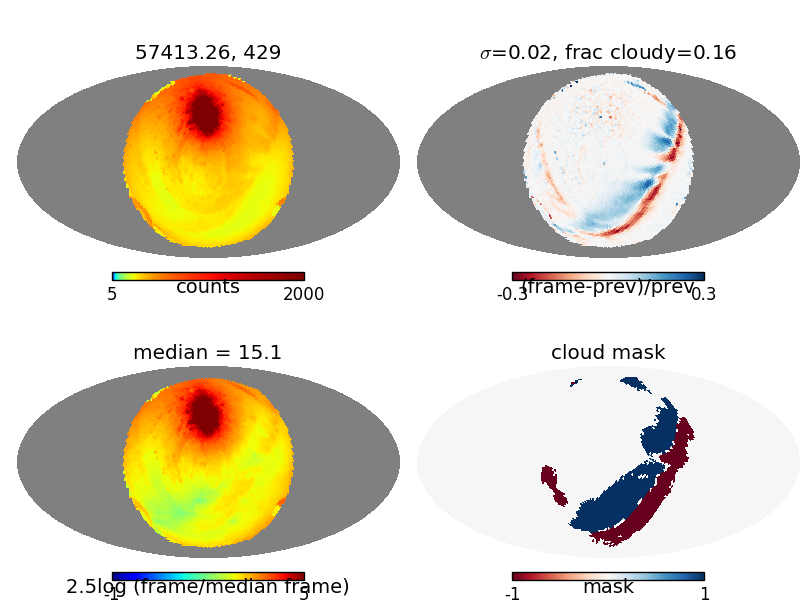
Figure 6 Same as Figure Figure 5, but now the moon is up and a narrow band of clouds are crossing the field.
Some possible issues with detecting clouds on the difference image:
- Only the leading edge of large clouds will be detected in the difference image. It may be better to build cloud masks from IR all-sky camera observations, and use the higher resolution optical image to fit the cloud layer altitude and velocity.
- It may not be possible to detect clouds during dark time as they pass through the galactic poles. This region is dark enough that the difference between a cloudy pole and a clear pole may not be significant in the difference image.
- Very small and/or narrow clouds (such as fresh contrails) may not be detected by our current filtering technique.
We should explore the possibility of using an IR all-sky camera rather than or in addition to an optical camera as clouds can easily be seen in emission in the IR. A possible downside is that IR cameras typically have lower resolution, thus it might make sense to fit the cloud altitude and velocities from the optical image and apply those fits to an IR-based cloud map.
How Often Would We Dodge Clouds
We have 181,397 frames from the all sky camera taken when the sun is below an altitude of 12 degrees. Doing initial chi-by-eye cuts on what constitutes “kinda cloudy” and “very cloudy”, it looks like ~75% of the frames are clear, with no significant clouds, then 5-10% of the time is “partly cloudy” where we might expect the scheduler to benefit from cloud avoidance information, and 10-20% of the time is very cloudy, where the telescope would most likely be closed. These numbers could change slightly with a more robust cloud detection algorithm, but this is consistent with the results from other surveys that find conditions are usually “clear” or “completely cloudy” with a very small fraction of time where it is partly cloudy and one would want to actively avoid clouds and target sucker holes.
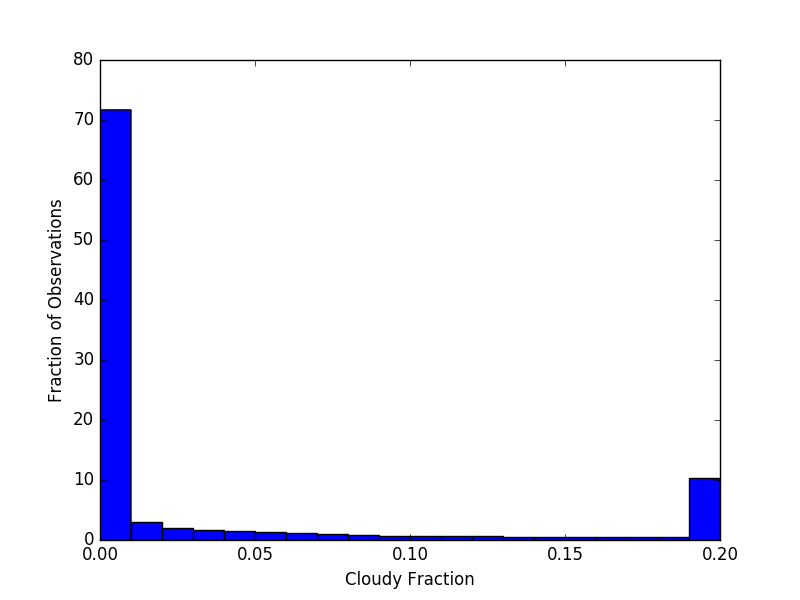
Figure 7 Histogram of how cloudy each frame is based on our simple cloud detection algorithm. We find ~75% of the time is clear, 5% is slightly cloudy, and 20% is very cloudy.
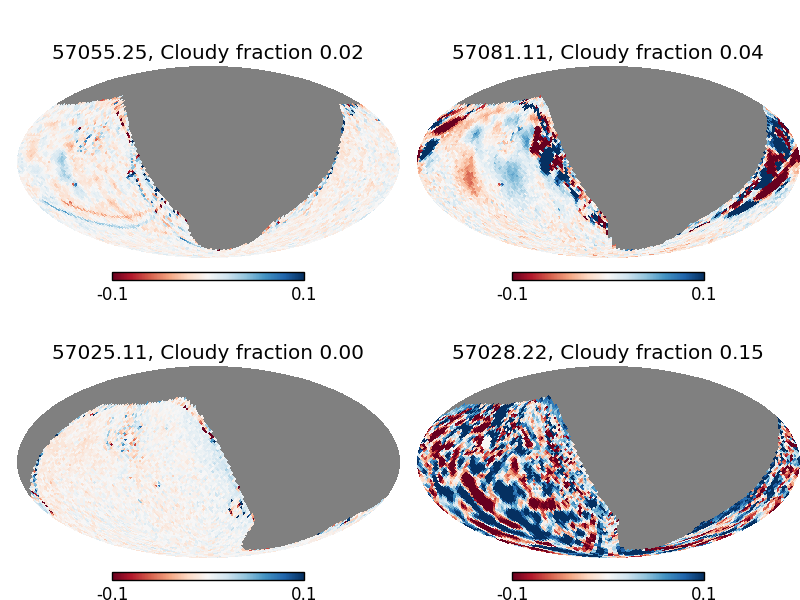
Figure 8 Example difference images showing partly cloudy conditions (top row), and clear and very cloudy conditions (bottom row).
We can also look at how many cloudy and clear frames there are per night.
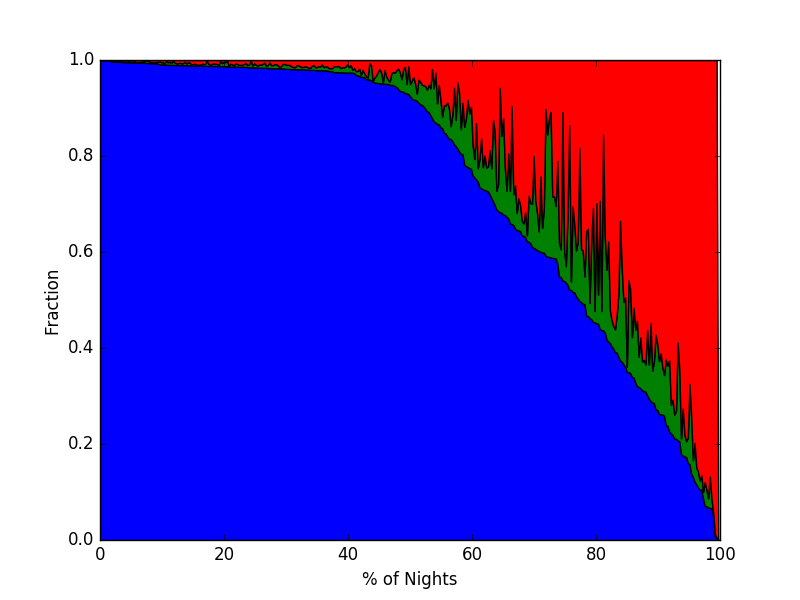
Figure 9 A stacked plot showing how many frames in each night are classified as clear (< 2% of pixels cloudy, blue), partly cloudy (up to 5% of pixels masked, green), and very cloudy (> 5% of pixels masked).
This shows ~60 of nights are nearly entirely clear. 5-10% of nights are also completely cloudy, meaning there would only be a strong demand for cloud avoidance on ~40% of nights.